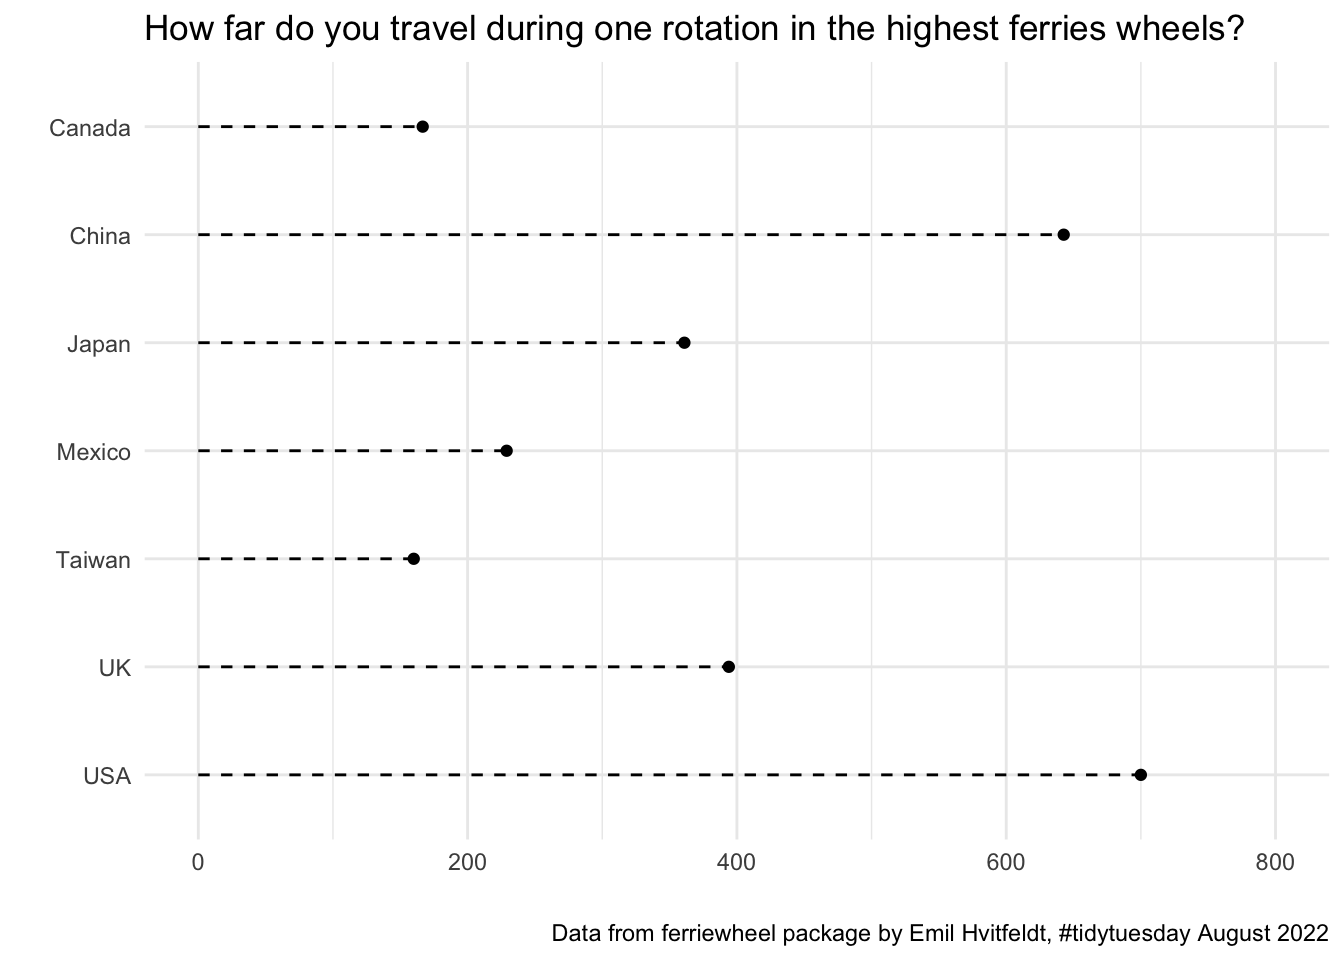
# install.packages("tidytuesdayR") install.packages("tidyverse")library(tidyverse)library(ggplot2)#data <- tidytuesdayR::tt_load("2022-08-09")$wheelsdata <-read_rds("data/wheels")highest <- data |>group_by(country) |>filter(height ==max(height, na.rm = T), country %in%c("Canada", "China", "Mexico", "Taiwan", "Japan", "Philippines", "UK", "USA")) |>select(country, height, diameter)ggplot(highest, aes(y =fct_rev(factor(country)), x = diameter)) +geom_point() +geom_segment(aes(y = country, yend = country, x =0, xend = diameter), linetype ="dashed") +labs(x ="", y ="",# x = "Diameter of the highest ferries wheel in the country (in meter)"title ="How far do you travel during one rotation in the highest ferries wheels?",caption ="Data from ferriewheel package by Emil Hvitfeldt, #tidytuesday August 2022") +scale_x_continuous(limits =c(0, 800)) +theme_minimal()